
May 31, 2017
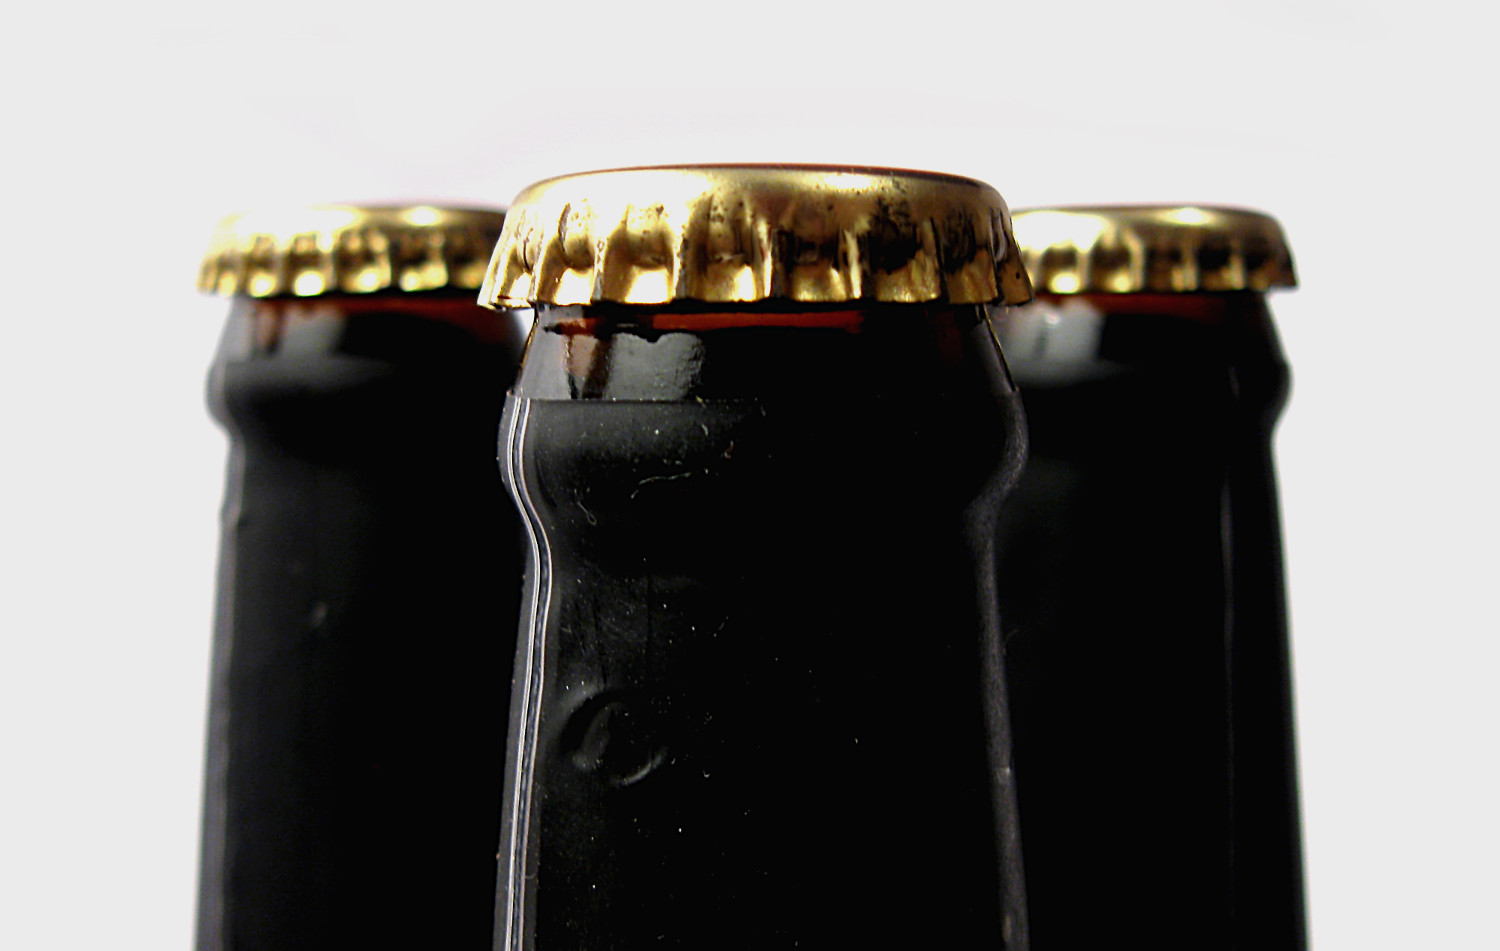
We’ve all seen the headlines and felt the squeeze: “Craft brewers battling a hop shortage”, “What’s the haps with the hop shortage?”, “Millennials love craft beer, but will a hops shortage leave them thirsty?”. It isn’t difficult to imagine a scenario where we’re forced to find an adequate substitute for a key aroma hop in one of our growing brands. In the event that all 2017 Mosaics are imperiled by a natural disaster (let’s hope not!) how will you determine which hop (or combination of hops) can fill in without producing a major flavor difference?
A derivative of this question is frequently posed to all food manufacturers, so a host of sensory difference testing methods have been developed to answer such questions; the triangle test being the most familiar, and commonly applied of them. The application of this method serves the purpose of determining whether a sensory difference exists between samples – in this case, your beer brewed with Mosaic and a prototype brewed with its substitute.
The premise of the triangle test is simple; panelists are presented with three samples that represent a control and a test batch (in this example the control would be your beer traditionally brewed with Mosaics and a test sample would be the new prototype beer brewed with a substitute hop). For the three samples, you need two from your control and one from the test batch (or vice versa, it doesn’t matter which is the ‘odd’ sample). Panelists are then asked to compare samples with respect to an overall, non-specified, sensory difference and choose the sample that is most different from the other two. If a significant number of panelist are able to select the ‘odd’ sample, then the samples are considered to be significantly different from each other. In our example that would mean that your substitute hop bill isn’t a great replacement, the change in flavor is just too dramatic and was detected by your panel. On the other hand, if the panelists can’t perceive a difference using this method, then you have a winner for your Mosaic hop substitution.
As you can see from our example, the most appropriate application for a triangle test (or any other difference test) is in developing new products or improving upon an existing product. It will help you answer whether or not changes made to the product (brewing process modifications, raw materials changes, fermentation or finishing parameters ext.) produce a significantly different flavor from a control. Clearly, it is a very useful test and should be included in your arsenal of sensory testing methodologies. However, it has many limitations when it comes to using this method for your routine quality control testing. My goal with this post is to share with you these limitations in order to convince you that there is a time and a place for difference tests, but routine taste panel is not one of them. Save yourself the hassle and read on to better understand the limitations of difference tests and what we recommend instead.
-
Too General and Too Sensitive
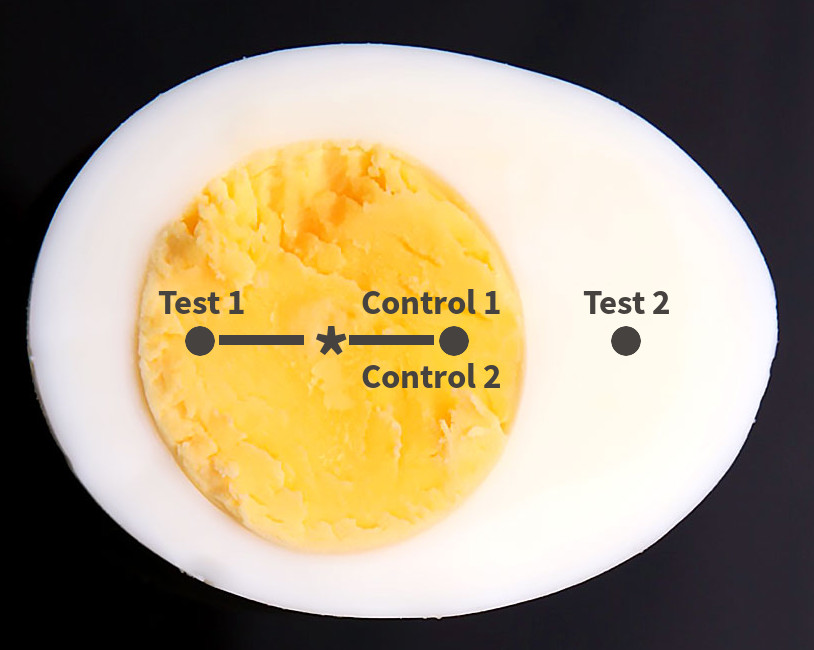
We are in the business of creating a fermented beverage composed of agricultural products subject to seasonal variation…there are going to be batch-to-batch differences! We need to know that this is not only ok, it’s expected…so long as the differences are within an acceptable range of variability. Imagine an “egg of product variability” (stay with me here…), the yolk is where you want to be (that’s where all of the good stuff lies after all!) and the white is outside of your acceptable range. It is feasible to have two samples that are quite different from each other but still fall within the yolk, or acceptable range (See Control 1 and Test 1). In a difference test, this test sample would be rejected on the basis of its difference from the control. Therein lies the first problem, a triangle test will not tell you the nature or magnitude of the difference between your samples. It’s possible the difference is that the sample is slightly duller than the control. Should you sound the alarm and send out the hounds for a slightly dull beer? No! This is an example of a sample that is different from the control but very likely to be within the range of normal/acceptable variability (see Control 1 and Test 1). Percent defect charting would allow such a sample to pass within the range of variability (see discussion about UCL’s in the Batch-to-Batch Variation in Brewing: Let P-Charts Do the Work blog post) preventing needless investigation due to a generalized result from an overly sensitive test.
-
Losing Control
The second problem is selecting a good control. Beer is a rapidly changing and complex product, so it is not feasible to maintain a constant gold standard product for comparison; determination of a difference can therefore shift daily, based solely on the selection and flavor drift of the control. Additionally, you may not detect a difference between a control that is too similar to the test sample, even if the test sample has a detectable off flavor, like acetaldehyde (see Control 2 and Test 2). In this case, the beer should fall out of the acceptable range of variability, and would, if you were asking your panelists about what they detect, but they might not actually identify the ‘odd’ sample from a difference test alone. These “control” limitations can all be overcome by switching out a difference test for a true-to-target (TTT) test for routine quality testing. In the TTT method your sample is being compared to dozens, and eventually hundreds of “control” samples in your p-chart analysis, giving you confidence when a sample is shown to be significantly different from hundreds of control samples or, even better, confidence when your sample is within the acceptable range of variation and is good to go.
-
Adrift on the Flavor Sea
In absence of a defined target description, applying difference testing leaves you susceptible to flavor drift over time. When performing a difference test, the evaluator is considering an arbitrary and vague target instead of constantly being pointed back to the “true north” of the brand’s target description. Again, using a true-to-target test resolves this problem for you.
-
How many panelists do I need?!
To establish an appropriate level of confidence at least 18(ish) panelists should be included in the evaluation (O’Mahony, M., 1986). In a small brewery, this can be very difficult, if not, impossible.
Take home: In quality assurance, the main question is: “is this sample within the brand’s normal flavor variation?” The triangle test can be incredibly powerful, but does not answer this basic question. Instead, it requires the use of multiple panelists, a stable control and the organization and evaluation of three samples (fatiguing); and in the end, all you know is if there is a difference between two samples, or not. The best tool to utilize and get to the heart of this basic QA question on a daily, batch-to-batch basis, is the “True-to-Target” test. The TTT test not only allows panelists to identify if a sample is different from normal production or outside specifications, but it also breaks down visual, taste, aroma and mouthfeel to that if something isn’t true to target, you’ll know exactly why. All you need is a solid target brand description, focused and trained panelists and a wee bit of statistical know-how to make sure you are making the highest-quality most consistent beer possible. Now, if only we could guarantee such confidence in Mosaic’s harvest and yield!
Reference: O’Mahony, Michael (1986). Sensory Evaluation of Foods, CRC Press, p.413.
